21
Si bien, es prematuro hablar de efectos en
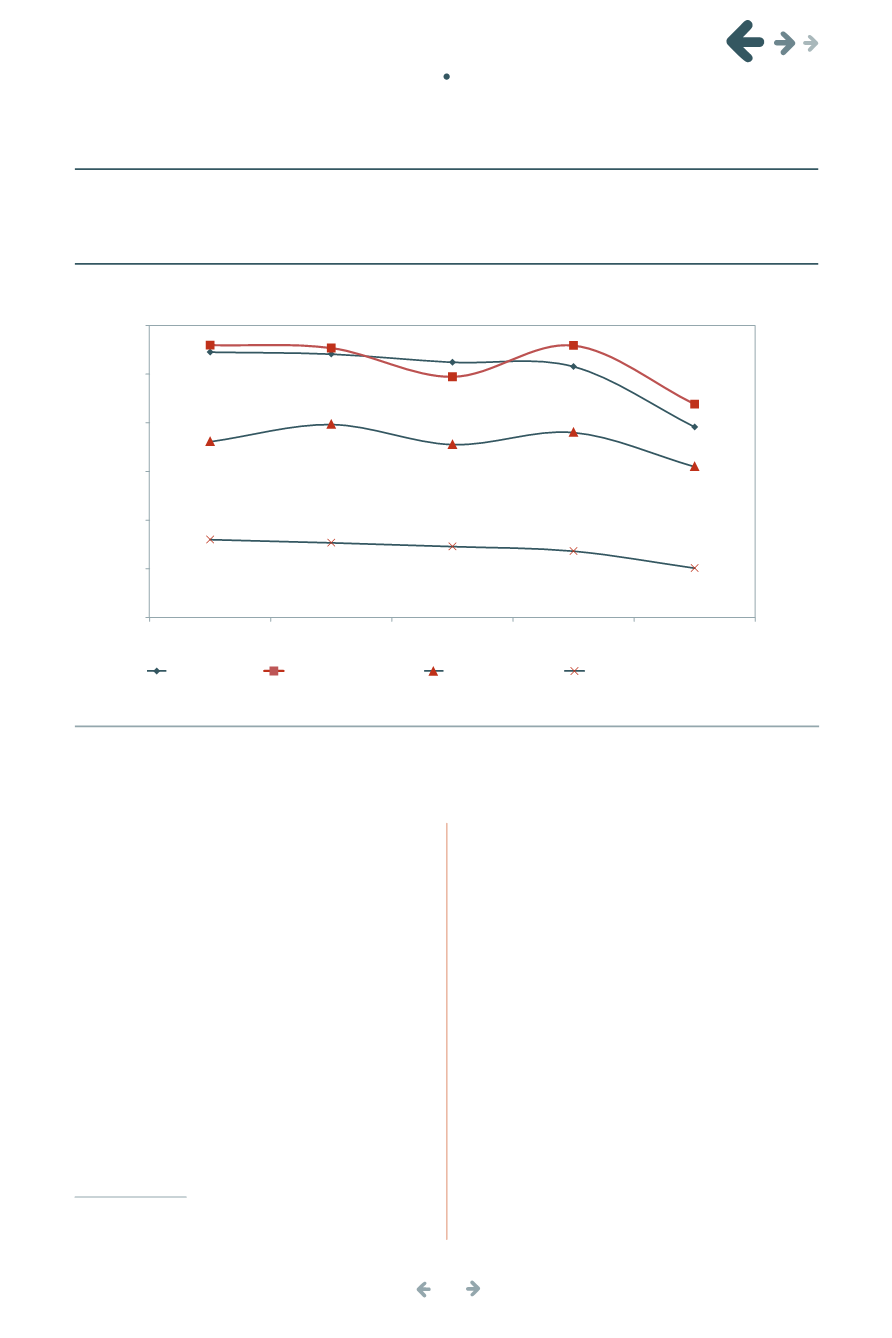
las condiciones de salud, los datos anuales indican
que el
ACA
ha incrementado la cobertura entre la
población inmigrante de bajos recursos. La propor-
ción de centroamericanos que se encontraban de-
bajo de la línea de pobreza y sin seguridadmédica
disminuyóde66a54por cientoen2014mientras
que en losmexicanos la reducción fue de 64 a 49
por ciento (véasegráfica6).
3
Unavariable relacionadacon lapobrezaycon
el acceso a la seguridadmédica es la condición de
ciudadanía y el estatus legal de los inmigrantes. La
población sin documentos se sitúa en una situación
doblementevulnerableen términosdesalud, debido
3
Paramayor información sobre losefectosdel ACA, véase:
-
tracking-survey
One variable relating to poverty and access
to medical insurance is immigrants’ citizenship
and legal status. The unauthorized population is
in a doubly vulnerable situation in terms of health
insurance, as they are excluded from government
programs and are usually engaged in occupations
that fail to provide medical insurance (Messias
et
al.
, 2015). In this regard, the link between immi-
grants’ employment and their level of coverage is
crucial to identifying social needs and the lack of a
political response.
Disparities bymainoccupation
Seven out of ten Latin American immigrants bet-
ween theagesof16and64participate in the labor
market, accounting for 8% of the
US
work force.
Gráfica6. Porcentajede lapoblación residenteen
EUA
encondicióndepobreza
sin seguridadmédicapor regiónopaísdenacimiento, 2010-2014
Chart6. Percentageof thepopulation residing in theUnitedStates inpoverty,
withoutmedical insurance, by regionor countryof birth, 2010-2014
Fuente: Elaboracióndel
CONAPO
conbaseenU.S. CensusBureau,
CurrentPopulationSurvey
(
CPS
), suplementodemarzo, 2010-2014.
IntegratedPublicUseMicrodataSeries (
IPUMS
)
EUA
,Minneapolis:
UniversidaddeMinnesota
.
Source: Producedby
CONAPO
basedonU.S. CensusBureau,
CurrentPopulationSurvey
(
CPS
),Marchsupplement2010-2014. IntegratedPublic
UseMicrodataSeries (
IPUMS
)U.S.,Minneapolis:
UniversityofMinnesota
.
64
64
62
62
49
66
65
59
66
54
46
50
46
48
41
26
25
25
24
20
10
20
30
40
50
60
70
2010
2011
2012
2013
2014
Mexicanos
Centroamericanos
Sudamericanos
SouthAmericans
Nativosblancosnohispanos
US-bornnon-Hispanicwhites
Mexicans
Central Americans
Porcentaje
Percentage
capítulo i i •
chapter i i


