12
encuentran por debajo de la línea de pobreza no
acceden a los nivelesmínimos de bienestar debido
a la insuficienciade los ingresos queperciben.
En general, los inmigrantes latinoamerica-
nos reportan un mayor porcentaje de población
en condición de pobreza que los nativos blancos y
aunque esta situación disminuye con el tiempo de
residencia, por ejemplo, del total de centroamerica-
nos con al menos diez años de residencia en
EUA
,
cerca de cinco de cada diez estaba por debajo del
umbral depobreza (42%),mientrasque, entrequie-
nesteníanmásdediezañosde radicarenesanación,
tres de cada diez eran pobres (31%). No obstante,
aún existen diferencias desfavorables respecto a
la población nativa blanca (10%). Es importante
at amuchhigher level. For example, amongCentral
Americans who had lived in the United States for
up to ten years, almost half (42%) were living be-
low the poverty line, which falls to about one-third
(31%) for thosewhohad lived in theUSmore than
ten years, but remains several times higher than
the
US
-born non-Hispanic white population rate
(10%). It is important to note that as with their
level of educational attainment, South Americans
are in amore favorable situation than other immi-
grants, and it is likely that theyhavehadbetter cir-
cumstances since their arrival (seeChart3).
Immigration status determines the immi-
grant’s ability to participate fully in society and af-
fects the resources and mechanisms available for
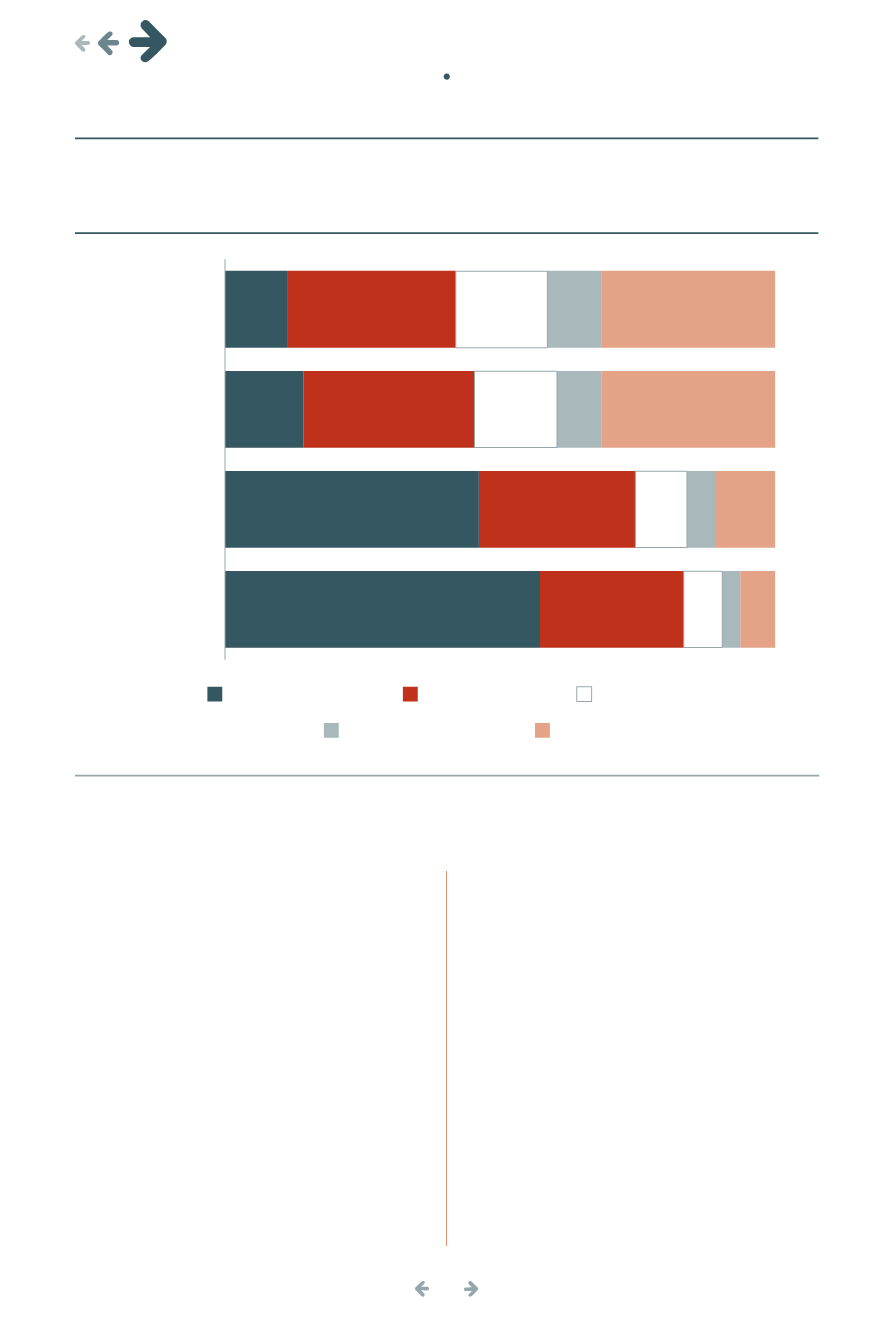
Gráfica2. Porcentajede lapoblaciónde25añosymás residenteen
EUA
,
por nivel educativo según regiónopaísdenacimiento, 2010-2014
Chart2. Percentageof populationover25 living in theUnitedStates,
by level of educational attainment, basedon regionor countryof birth, 2010-2014
Fuente: Elaboracióndel
CONAPO
conbaseenU.S. CensusBureau,
Current PopulationSurvey
(
CPS
), suplementodemarzo, 2010-2014.
IntegratedPublicUseMicrodataSeries (
IPUMS
)
EUA
,Minneapolis:
UniversidaddeMinnesota
.
Source: Producedby
CONAPO
basedonU.S. CensusBureau,
CurrentPopulationSurvey
(
CPS
),Marchsupplement2010-2014. IntegratedPublic
UseMicrodataSeries (
IPUMS
)
U.S.
,Minneapolis: UniversityofMinnesota.
57.3
46.2
14.3
11.4
3.3
5.3
8.0
9.8
6.3
10.8
31.6
31.6
Mexicanos
Mexicans
Centroamericanos
Central Americans
Sudamericanos
SouthAmericans
Menosde12grados/
Completed less thanhigh school
High school terminada/
Graduated fromhigh school
Licenciatura inconclusa/
Unfinishedbachelors’ degree course
Técnico superior/
Completedbachelors' degree
Profesional ymás/
Professional school degreeor higher
Nativosblancos
nohispanos
US-born
non-HispanicWhites
Porcentaje/
Percentage
7.0
9.4
15.0
16.7
26.1
28.5
31.1
30.5
migración y salud •
migration and health


