28
2005; Fisher-Hoch
et al.
, 2010 yWolstein
et al.
,
2015). Por suparte, la diversidadde alimentos de
Estados Unidos, al igual que en otros países, ha
facilitado la transición nutricional que se caracte-
riza por un cambio de dieta que incluye unmayor
consumo de alimentos altamente procesados y
calóricos aunado a realizar menos actividad física
(Rivera
et al.
, 2014).
La relación entre el tiempo de residencia en
EUA
y los niveles de obesidad se refleja claramente
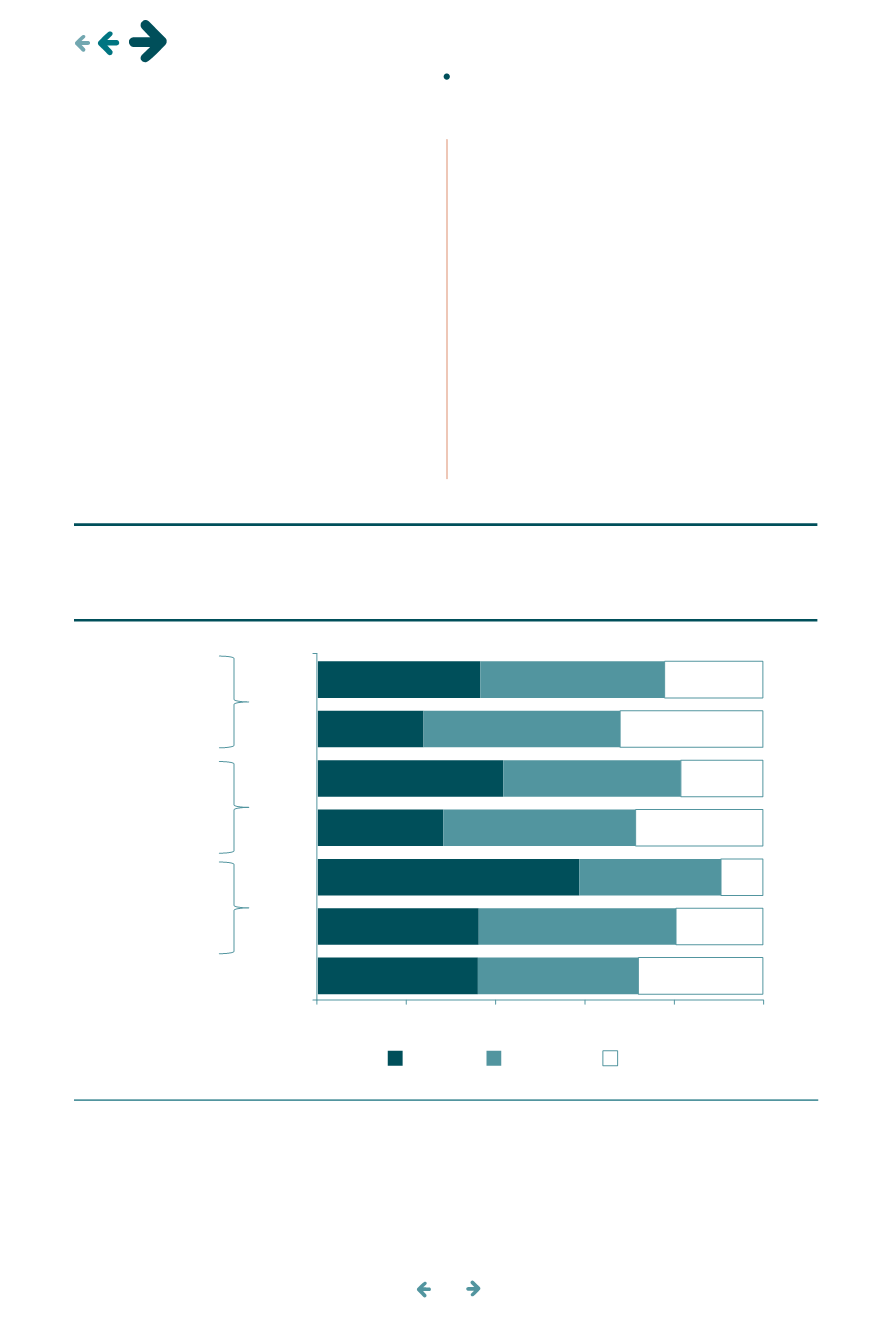
en lascifras. En losmexicanosmayoresde18años,
conmenosdediezañosde residencia, seisde cada
diez tenían sobrepeso uobesidad, mientras que en
aquellos conmás de diez años en ese país, la tasa
thewealthof the
US
, as inother countries, has facili-
tated a nutritional transitionmarked by a change in
diet that includes higher consumptionof highlypro-
cessedand caloricallydense foods and less physical
activity (Rivera
etal.
, 2014).
The relationshipbetweenyears inthe
US
and
obesity is clear in the data. AmongMexicans over
18with fewer than ten years
’
of
US
residence, six
out of ten suffer fromoverweight or obesity, while
among those resident in the country for over ten
years, the rate increases to eight out of ten. This
pattern is reproduced among Central and South
Americans, and the latter display an even greater
increase between the two periods of residence in
Gráfica8. Porcentajede lapoblaciónde18añosymáspor tiempode residenciaen
EUA
según regióno
paísdenacimientoy categoríadel ÍndicedeMasaCorporal (
IMC
), 2010-2014*
Chart8. Percentageof populationover18, by lengthof residence in theUnitedStates, basedon countryor
regionof birthand categoryofBodyMass Index (
BMI
), 2010-2014*
*Normal >=18.5y<25.0
IMC
; Sobrepeso>=25.0y<30.0
IMC
; Obesidad (incluyeObesidadextrema) >=30. Seexcluyódesnutrición
yaque representabamenosdeunopor cientopor cadagrupo.
Fuente: Elaboracióndel
CONAPO
conbaseen
National Health InterviewSurvey
(
NHIS
), 2010-2014. IntegratedPublicUseMicrodata
Series (
IPUMS
)
EUA
,Minneapolis:
UniversidaddeMinnesota
.
*Normal
BMI
>=18.5and<25.0; Overweight
BMI
>=25.0and<30.0; Obese
BMI
(includes extremeobesity) >=30. Cases ofmalnutritionwere
excluded, as they representedunder 1%of eachgroup.
Source: Produced by
CONAPO
, based on the
National Health Interview Survey
(
NHIS
), 2010-2014. Integrated Public Use Microdata Series
(
IPUMS
)
U.S.
,Minneapolis:
UniversityofMinnesota
.
0
20
40
60
80
100
>=10años
<10años
>=10años
<10años
>=10años
<10años
Normal
Normal
Sobrepeso
Overweight
Obesidad
Obesity
Mexicanos
Mexicans
Centroamericanos
Central Americans
Sudamericanos
SouthAmericans
Nativosblancosnohispanos
US-bornnon-HispanicWhites
>=10years
<10years
>=10years
<10years
>=10years
<10years
36.0
36.2
58.8
28.2
41.7
23.7
36.5
36.1
44.3
31.8
43.3
39.9
44.2
41.4
28.0
19.5
9.4
28.6
18.4
32.1
22.1
migración y salud •
migration and health


