 
          
            32


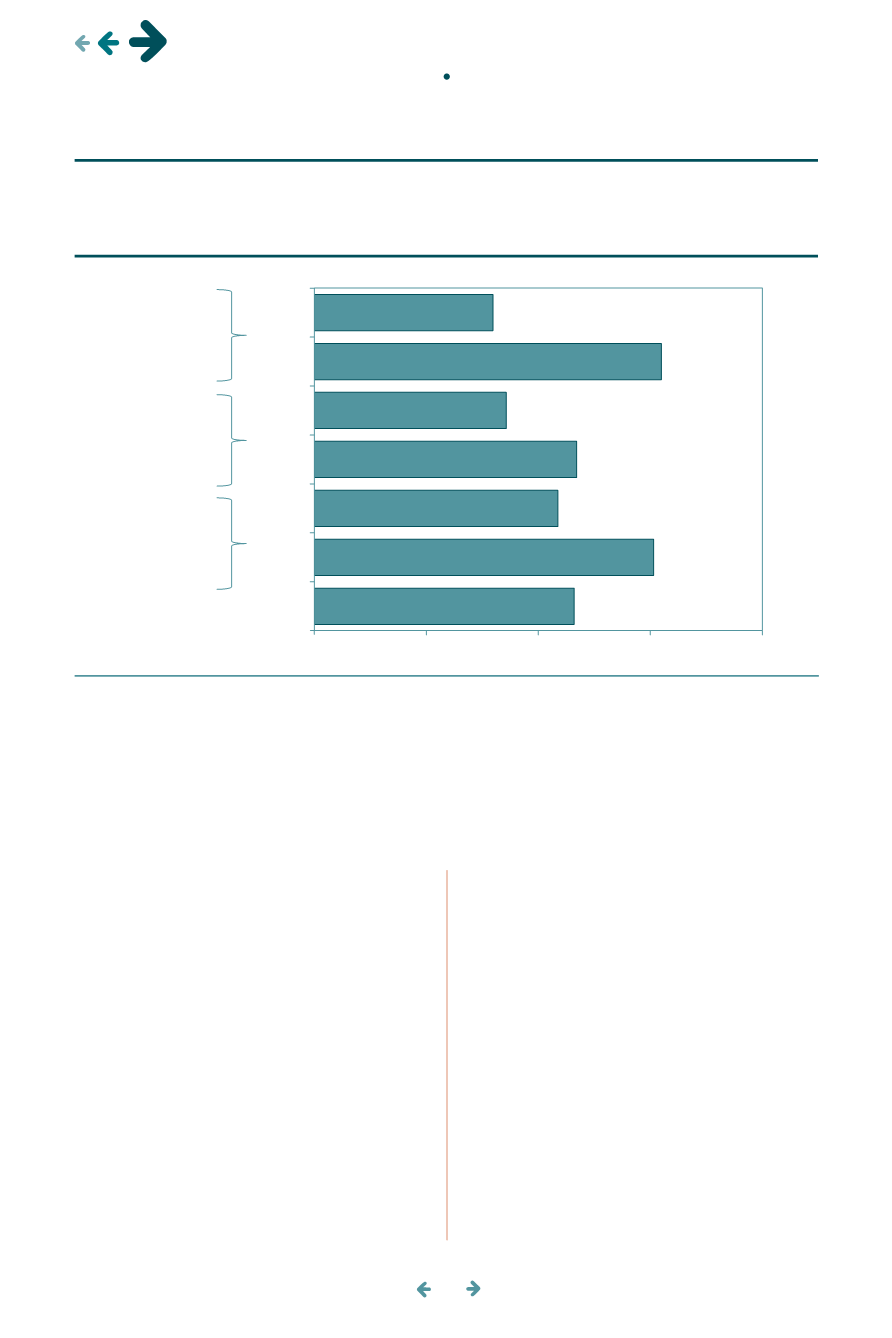
            Gráfica10. Porcentajede lapoblaciónde18añosymáspor tiempode residenciaen


            EUA


            quehapadecido


            algún sentimientodesesperanzador,* según regiónopaísdenacimiento, 2010-2014


            Chart10. Percentageof populationover18, by lengthof residence in theUnitedStates, havingexperienced


            feelingsof despair,*basedon countryor regionof birth, 2010-2014


          *Algún sentimientodesesperanzador refierea tristeza, faltadeesperanza, ideasnegativas sobre lapropiapersonao sobre lavida,
        
        
          a losque seagreganestrés, ansiedady faltade concentración, todoel tiempoen losúltimos30díasanterioresa laentrevista, que
        
        
          hanafectado lavida cotidianadelmigrante.
        
        
          Fuente: Elaboracióndel
        
        
          CONAPO
        
        
          conbaseen


            NationalHealth InterviewSurvey


          (
        
        
          NHIS
        
        
          ), 2010-2014. IntegratedPublicUseMicrodata
        
        
          Series (
        
        
          IPUMS
        
        
          )
        
        
          EUA
        
        
          ,Minneapolis:


            UniversidaddeMinnesota


          .
        
        
          * Feelings of despair refer to sadness, hopelessness, negative perception of themselves or life, stress, anxiety and lack of concentration, all
        
        
          alongduring the30daysprior to the interview, whichhaveaffected themigrant’severyday life.
        
        
          Source: Produced by
        
        
          CONAPO
        
        
          , based on the


            National Health Interview Survey


          (
        
        
          NHIS
        
        
          ), 2010-2014. Integrated Public Use Microdata Series
        
        
          (
        
        
          IPUMS
        
        
          )
        
        
          U.S.
        
        
          ,Minneapolis:


            UniversityofMinnesota


          .
        
        
          Mexicanos
        
        
          Centroamericanos
        
        
          Sudamericanos
        
        
          Nativosblancosnohispanos
        
        
          Mexicans
        
        
          Central Americans
        
        
          SouthAmericans
        
        
          US-bornnon-Hispanicwhites
        
        
          11.6
        
        
          15.1
        
        
          10.9
        
        
          11.7
        
        
          8.6
        
        
          15.5
        
        
          8.0
        
        
          0
        
        
          5
        
        
          10
        
        
          15
        
        
          20
        
        
          >=10años
        
        
          <10años
        
        
          >=10años
        
        
          <10años
        
        
          >=10años
        
        
          <10años
        
        
          >=10years
        
        
          <10years
        
        
          >=10years
        
        
          <10years
        
        
          >=10years
        
        
          <10years
        
        
          zadoro transtorno, comparadocon11.6por ciento
        
        
          de los nativos blancos.
        
        
          Si bienel temade lasaludmental de los inmi-
        
        
          grantesameritamás investigaciones(Bhugra,2004;
        
        
          Guarniccia


            et al.


          , 2005), hasta el momento se ha
        
        
          documentado que la inestabilidad laboral y econó-
        
        
          mica, al igual que las expresiones de racismo y dis-
        
        
          criminación tienen efectos negativos significativos
        
        
          sobre este grupo de población (Kirmayer, 2010;
        
        
          Lindert


            et al.


          , 2009; Beiser, 2009).


            Envejecimiento


          Los inmigrantes latinoamericanos de65años ymás
        
        
          en Estados Unidos han aumentado su presencia en
        
        
          in1994 increasing to9and14% in2014, respecti-
        
        
          vely. On the other hand, rates amongCentral Ame-
        
        
          rican immigrants remained stable, at 6%. The Latin
        
        
          American population ages 65 and over rose from
        
        
          433000 to1379000, increasingby two hundred
        
        
          percent within this period and representing 6% of
        
        
          thispopulationgroup.
        
        
          Part of the reason for the increase in the
        
        
          number of older immigrants is the decrease in
        
        
          the number of seasonal migrants who repeatedly
        
        
          cross the border depending on the availably of
        
        
          work and eventually retire in their homeland. Im-
        
        
          migrants now remain longer in the United States
        
        
          because of the difficulty of crossing the border
        
        
          without documentation and stiffer border secu-


            migración y salud •


            migration and health