80
vascular diseases and cancers, and are only higher
than those of African Americans for unintentional
injuries for thisagegroup. However, theyhave the se-
cond highest rate of diabetes mellitus, after African
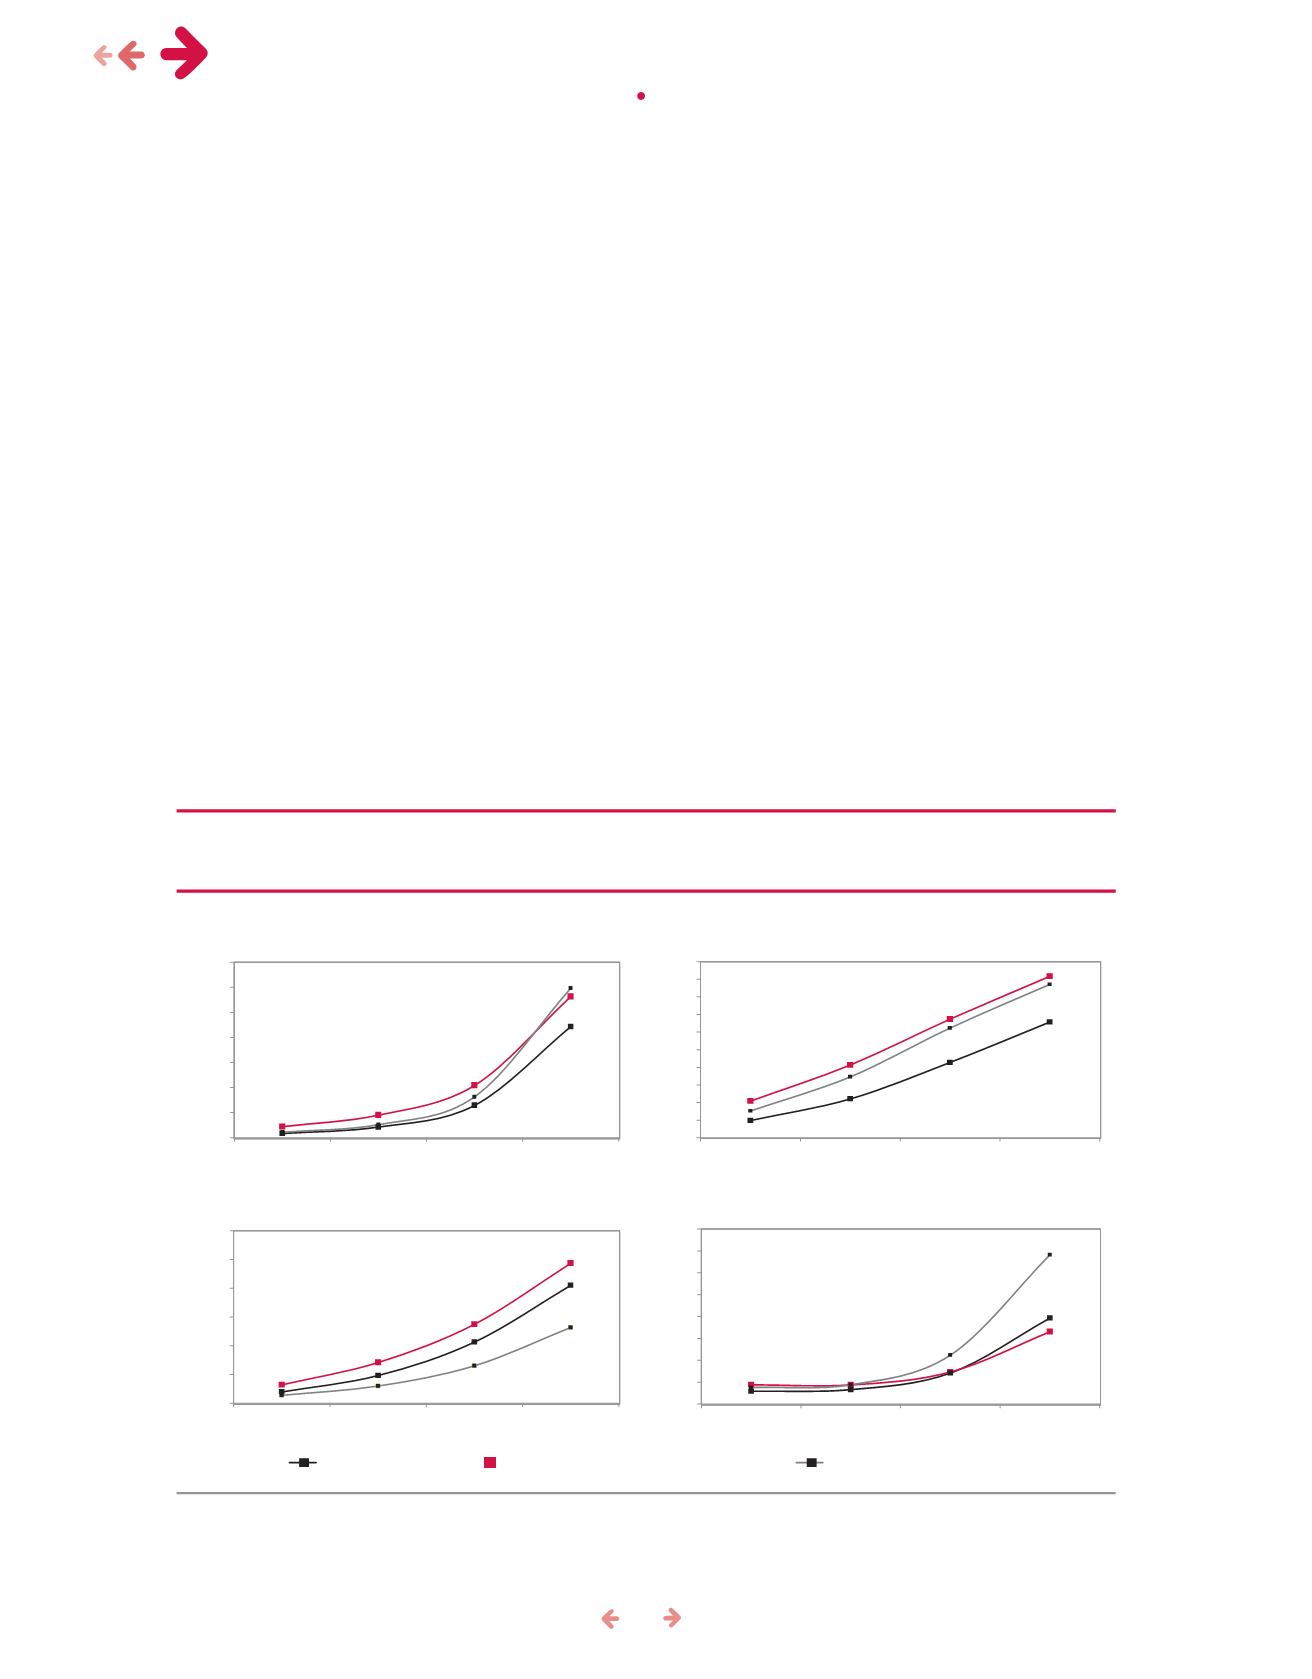
Americans (Figure71).
The prevalence of diabetesmellitus among the
Hispanic population represents a severe health pro-
blem, sinceafter theageof55 itexceeds themortality
rateof thewhite population, agap that increaseswith
age. The difference for the age group 75 to 84 years
is particularly striking, as diabetes accounts for 213
deathsper 100000persons, while forwhites it isonly
130deaths.Themagnitudeof thisgap ismaintained in
theoldest age group (85 and above), whereHispanics
havea rateof 410deaths per 100000persons, com-
pared to264deaths for thenon-Hispanicwhitepopu-
lation (Figure71). This situation canbeexplainedby a
combination of factors, including the high percentage
of overweight persons in the Hispanic community, in-
sufficient physical activity, higher alcohol consumption
and a lack of adequate primarymedical caremanage-
ment following the diagnosis, which the Hispanic po-
pulation shares with African Americans. Diabetes risk
factors, includingpoordiet, lackofdiagnosisand timely
care, andunhealthy lifestyles, arehighestamong those
with the lowest incomes (phc, 2002).
The leading causes of infant deaths among
theHispanic population are congenital
anomalies
During the period2002-2004 and2008-2010, the-
re has been a decrease in infantmortality rates in all
population groups, though the declinewas less in the
Hispanic population (3.9%) and the highest was in
the African American population (11%). In contrast,
in the non-Hispanicwhite population the declinewas
6.6% (see Figure72).
migration & health •
mexican immigrants in the us: a 10 year perspective
Source: Produced by CONAPO based on data fromCenters for Disease Control (CDC) and Prevention and theNational Center for
HealthStatistics (NCHS), National Vital StatisticsSystem (NVSS), Deaths, 2008-2010.
Figure71. Principal causesofmortalityamong thepopulationabove55Years in theUnitedStates
byagegroups, byoriginandethnicityor race, 2008-2010
169
427
1290
4432
441
903
2088
5630
219
524
1633
5964
0
1000
2000
3000
4000
5000
6000
7000
55-64years 65-74years 75-84years 85+years
55-64years 65-74years 75-84years 85+years
55-64years 65-74years 75-84years 85+years
55-64years 65-74years 75-84years 85+years
Deathsper 100000
Deathsper 100000
Deathsper 100000
Deathsper 100000
197
442
856
1315
417
827
1348
1834
306
692
1247
1743
0
200
400
600
800
1000
1200
1400
1600
1800
2000
39
97
213
410
64
142
275
487
28
60
130
264
0
100
200
300
400
500
600
30
33
71
197
44
44
73
166
38
44
112
341
0
50
100
150
200
250
300
350
400
HispanicN
on-HispanicAfricanAmericans
Non-Hispanicwhites
Diabetesmellitus
Cardiovascular diseases
Unintentional Injuries
Cancer


