76
Mexicanwomenhave reduced their likelihood
of becomingmothersatanearlyage
Significant changes took place in the specific fertility
rates by age group for women of Mexican descent
in the period between 2004 and 2011. Whereas in
2004 the fertility structure was characterized by an
early peak curve, with the highest fertility among
20 to 24-year-olds (112 births per 1,000 women),
by 2011 it had become a dilated peak curve, typical
of populations with a low fertility rate, with the hig-
hest fertility among 20 to 24-year-olds and 25 to
29-year-olds (112 and118births per 1,000women,
respectively) (Figure66). During the sameperiod, the
fertility rate for Mexican adolescents of Hispanic ori-
gin fell from 90 to 48 births per 1,000women. This
speaksof thedeclineofmotherhood in thenumber of
teenagers and youngMexicanwomen.
In the case of women ages 30 to 44, although
their fertility rate decreased, this did not happen as
quicklyasamongyounger agegroups (Figure66). The
reduction in birth and fertility rates can be attributed,
among other factors, to the adoption of the predomi-
nant reproductivepatternof thehost societyaswell as
the replicationof the reproductivepatternof thesocie-
ty of origin since these rates are also falling inMexico
and thedecrease in themigratoryflow(phc, 2011).
The average age at whichMexican
women have their first child increased
by almost a year
The change in Mexican women’s fertility patterns is
also reflected in the average age at which their first
child isborn.Over thepastnineyears,Mexican,Central
American, South American and African Americanwo-
menhavedelayed thebirthof their firstbornbyalmost
ayear. In2012,MexicanandAfricanAmericanwomen
had theyoungest averageages of becomingfirst-time
mothers (23.2 and23.6 years, respectively), followed
byCentral American and SouthAmericanwomen and
non-Hispanic white women, who had an average age
that was three years older (26.2 and 26.6 years, res-
pectively) (Figure67).
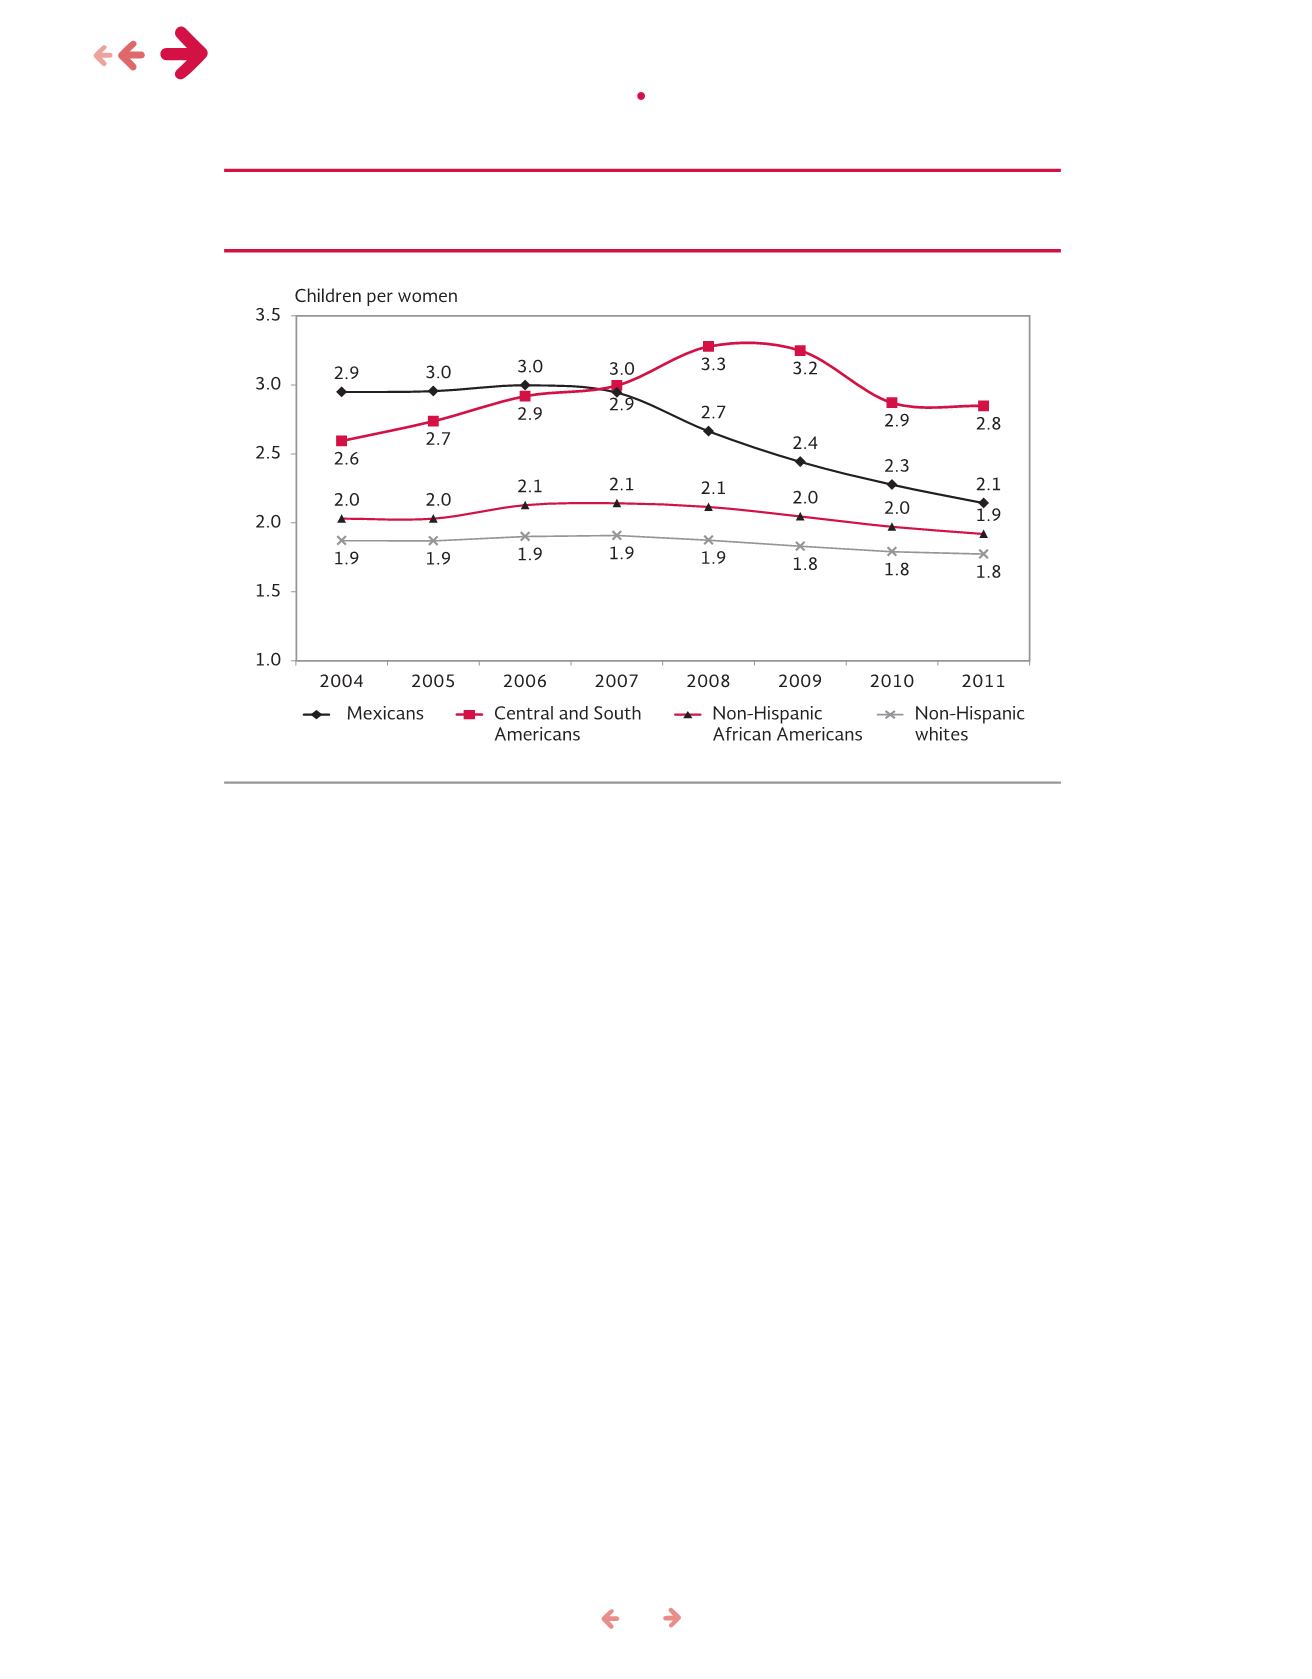
Source: ProducedbyCONAPObasedondata fromCenters forDiseaseControl (CDC)andPreventionand theNational
Center forHealthStatistics (NCHS), National Vital StatisticsSystem (NVSS), Births, 2012.
Figure 65. Total fertility rate in theUnited States, by origin and ethnicity or race of
mother, 2004- 2011
migration & health •
mexican immigrants in the us: a 10 year perspective


