78
Source: ProducedbyCONAPObasedondata fromCenters forDiseaseControl (CDC)andPreventionand theNational
Center forHealthStatistics (NCHS), National Vital StatisticsSystem (NVSS), Births, 2012.
Figure67. Averageageofmotherwhengivingbirth tofirst child in theUnitedStates,
byoriginandethnicityor race, 2004and2012
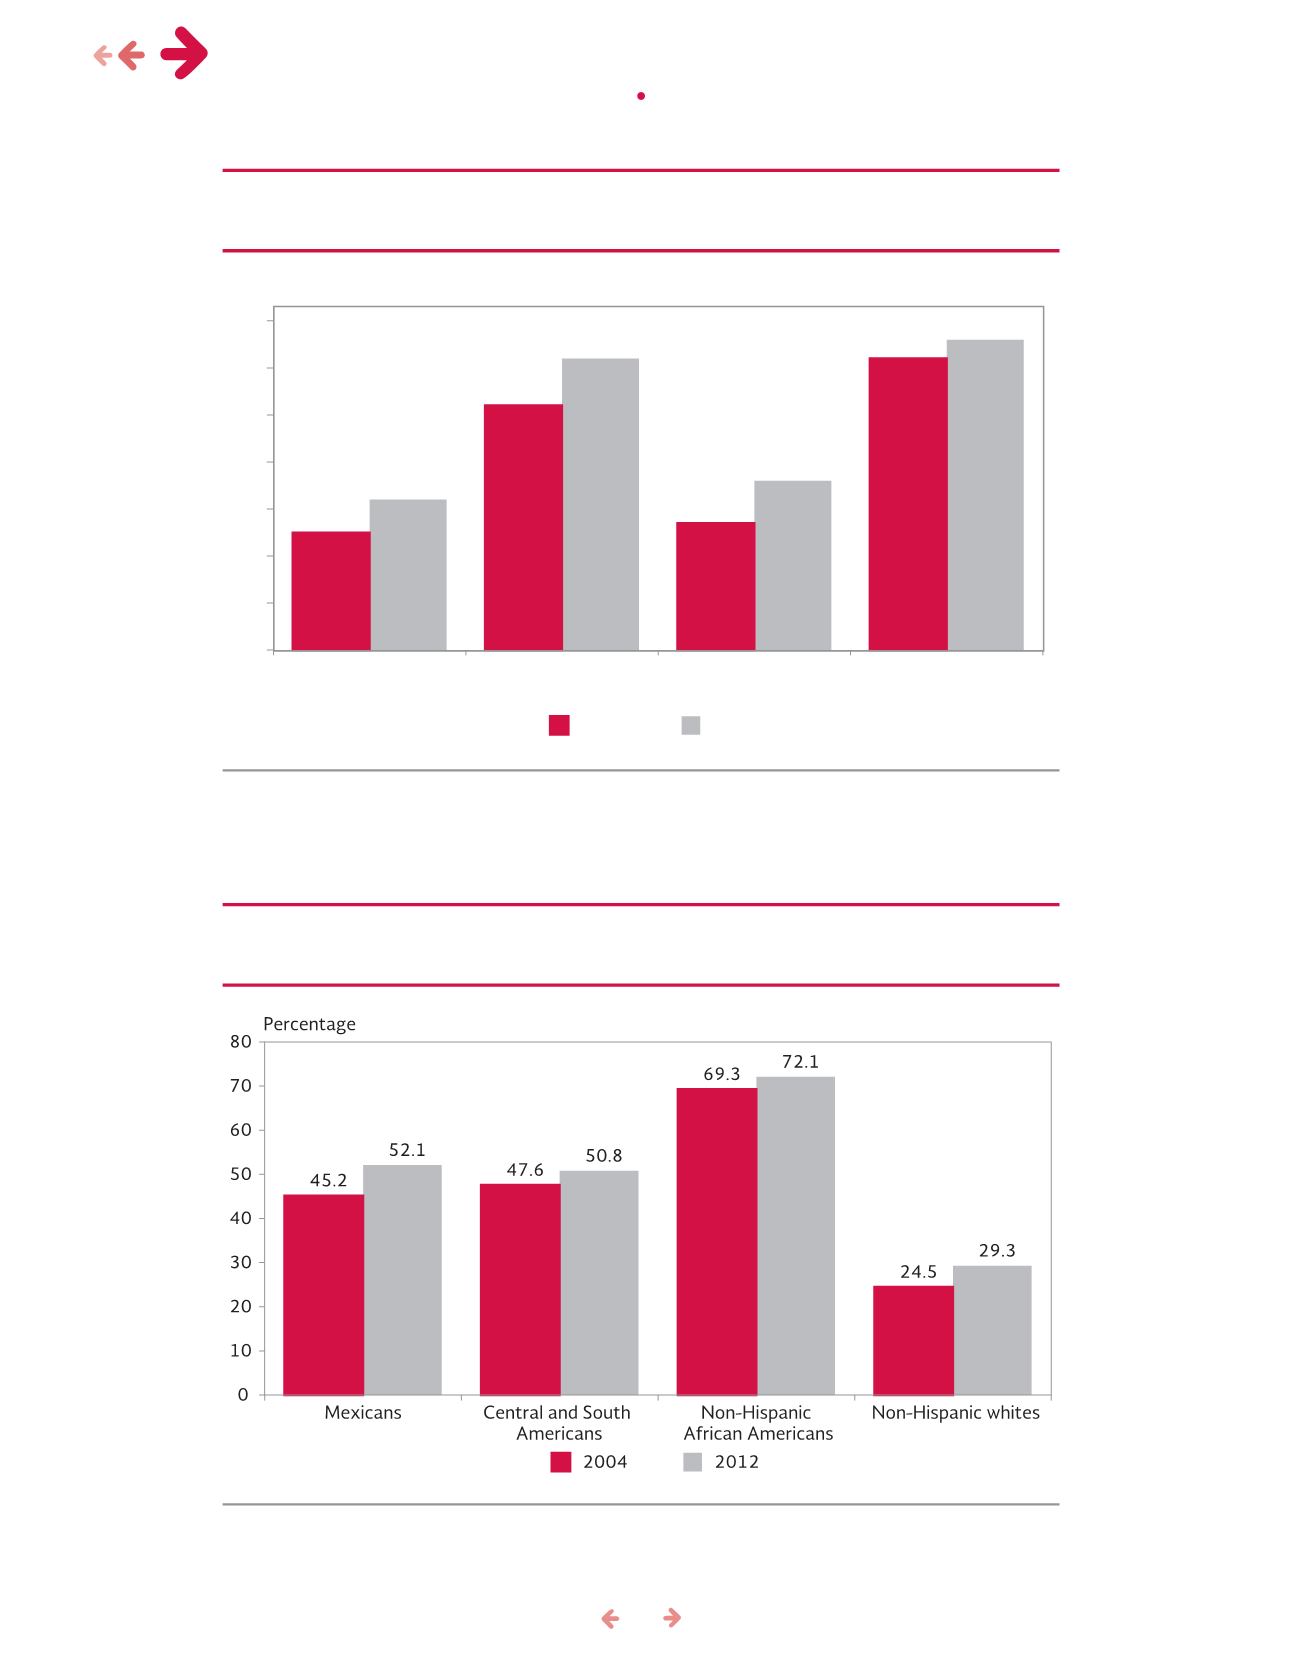
Source: ProducedbyCONAPObasedondata fromCenters forDiseaseControl andPrevention (cdc) and theNational
Center forHealthStatistics (nchs), National Vital StatisticsSystem, Births, 2012.
Figure68. Percentofmotherswhoareunmarriedwhengivingbirth to theirfirst child,
UnitedStates, byoriginandethnicityor race, 2004and2012
22.5
25.2
22.7
26.2
23.2
26.2
23.6
26.6
20
21
22
23
24
25
26
27
Age
2004
2012
Mexicans
Central andSouth
Americans
Non-Hispanic
AfricanAmericans
Non-Hispanicwhites
migration & health •
mexican immigrants in the us: a 10 year perspective


