21
Ingeneral, between2004and2013, the rateof
economic participation of immigrants resident in the
UnitedStates fell,with theexceptionofCentral Ameri-
cans, whoeven recordedamoderate increase. Thede-
crease in economic participation rates in each group is
not statistically significant, with the exception of Afri-
canAmericans, who lost over four percentagepoints.
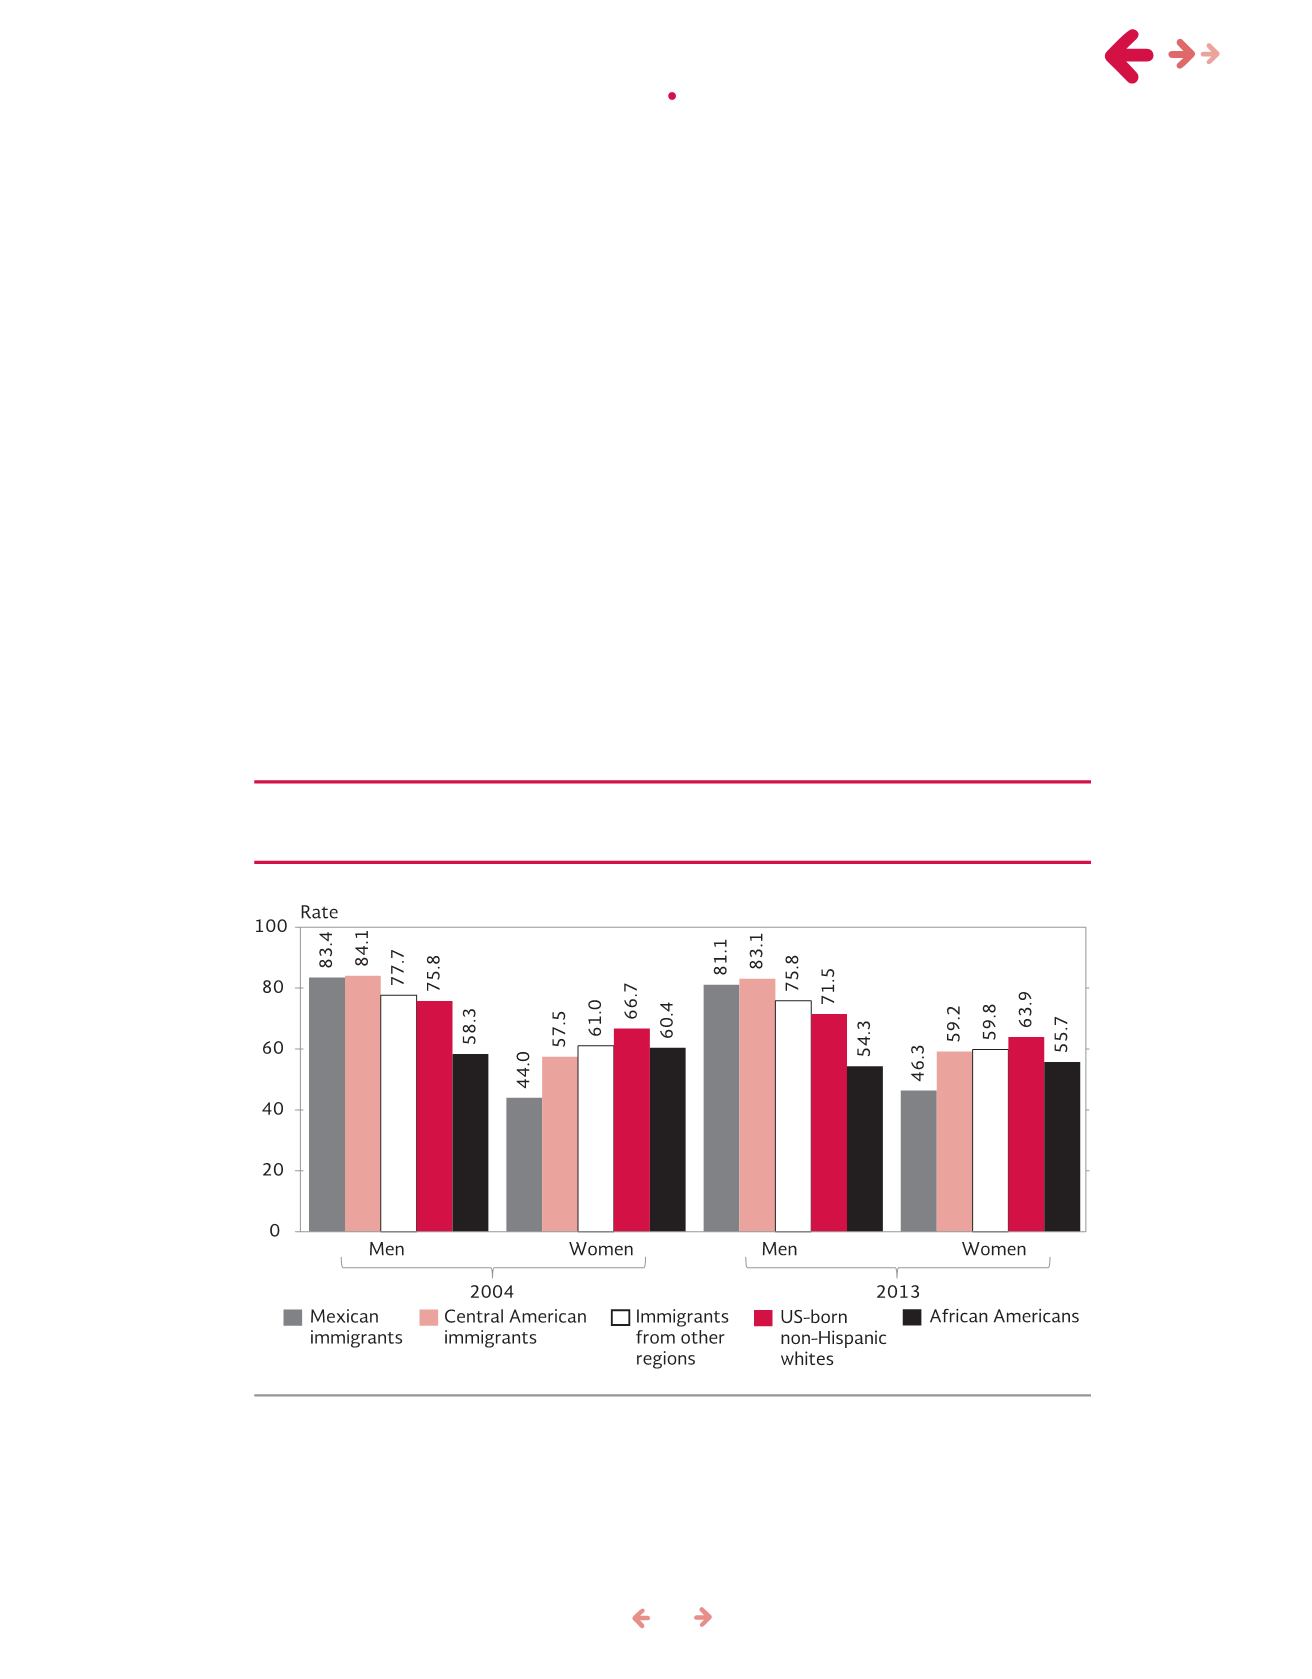
An analysis of economic activity by gender
shows that the low rate among theMexican group is
explainedby the low rateof femaleeconomic activity,
farbelow thatof their counterparts fromother regions
of theworld andUS-born citizens, a situation that has
not noticeably changed in recent years. On the other
hand, Mexicanmen display a similar economic partici-
pation rate to that of Central Americanmigrants, and
ahigher rate thanother immigrants andUS-bornnon-
Hispanicwhites andAfricanAmericans (Figure9).
Participationof themigrant population
in theproductive sectors
TheoccupationofMexican immigrants, both in2004
and2013, has been concentrated in three categories:
sevenout of ten are low-income serviceworkers, spe-
cialized laborers and construction workers. There are
slight differences in the distribution by occupation in
comparison with Central Americans, but the largest
differencesarewith immigrants fromother regions, as
well asUS-bornnon-HispanicwhitesandAfricanAme-
ricans. US-born non-Hispanic whites and immigrants
fromother regions have a particularly high concentra-
tion in the category of executives, professionals and
technicians (Table2).
Note:
1/Populationbetween15and64yearsold.
Source: Migration Policy Bureau, SEGOB, based on U.S. Census Bureau,
Current Population Survey
(CPS), for March
2004andMarch2013. IntegratedPublicUseMicrodataSeries (IPUMS)USA,Minneapolis: UniversityofMinnesota.
Figure9. Rateof economicparticipation (percent) of thepopulation
1
of theUnited
States for sex, by regionor originandethnicityor race, 2004and2013
chapter i •
characteristics of mexican immigrants in the united states


