14
group intheUnitedStates,withasimilarnumber tothat
of all immigrants from Asian countries and exceeding
thatofother LatinAmericansandEuropeanscombined.
However, theproportionofall immigrants intheUSwho
wereMexicanexperiencedaslightdecreaseduring that
period, from29 to27%,while theproportion fromAsia
increased from 25 to 29% (Figure 3). Meanwhile, the
proportionof Europeanpopulation fell by threepercen-
tagepoints,while immigrants from the restof theAme-
ricancontinent remainedat approximately24%.
TheMexicanmigrant population living
in theUnited States is concentrated
inworkingages
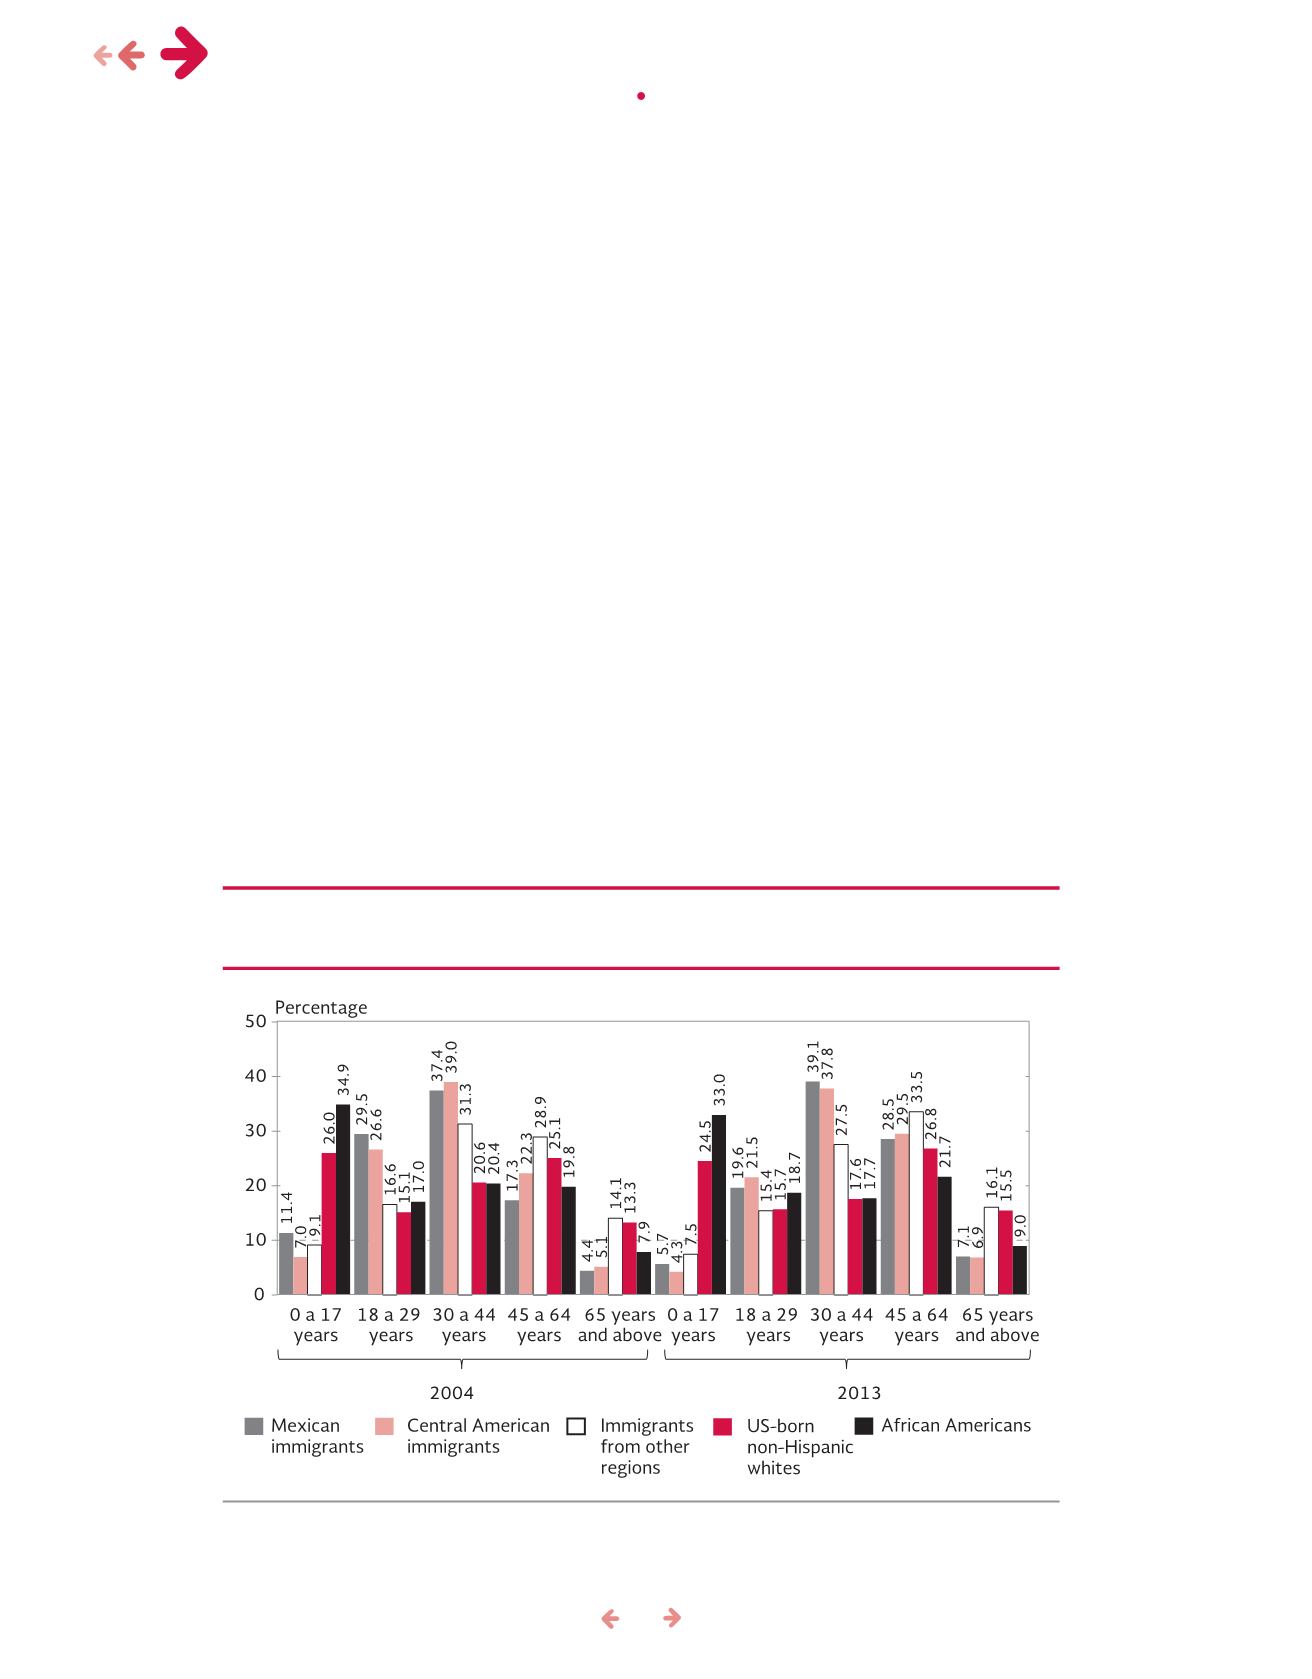
Between 2004 and 2013, the number of under-18
year-oldsamong thepopulationsconsideredherede-
creased, and there has been a simultaneous increase
in adults ages 45 to 64 and those over 65.The nati-
ve populations, both non-Hispanic white and African
American, had predominantly young age structures
in 2013, with the most common age group being
under-18 year-olds (25% and 33%, respectively).
In contrast, among immigrant populations themost
common age groups are ages 30-44 and 45-64.
Among these age groups, the proportion of under-
18s decreased and that of older adults increased
between 2004 and 2013 in all populations. Among
Mexican immigrants, there were more youth (ages
0-17) thanolder adults (ages65+) in2004, abalan-
cewhich reversed by2013 (Figure4).
Demographicaging in theUnitedStates
The process of demographic aging in theUnited Sta-
tes has been takingplace for several years and stems
fromadeceleration inpopulationgrowth, resulting from
a drop in the fertility rate and an increase in life ex-
pectancy. Migration has undeniably played a part to
the slowdownof thisdemographicphenomenon. Bet-
ween2004and2013, theaverageageof theUSpo-
pulation rose from36 to37.6years. Immigrantsborn
Source: Migration Policy Bureau, SEGOB, based on U.S. Census Bureau,
Current Population Survey
(CPS), for March
2004andMarch2013. IntegratedPublicUseMicrodataSeries (IPUMS)USA,Minneapolis: UniversityofMinnesota.
Figure4. DistributionofUnitedStates population, basedon region
of originandethnicityor race, byagegroup, 2004and2013
migration & health •
mexican immigrants in the us: a 10 year perspective


