19
Notes:
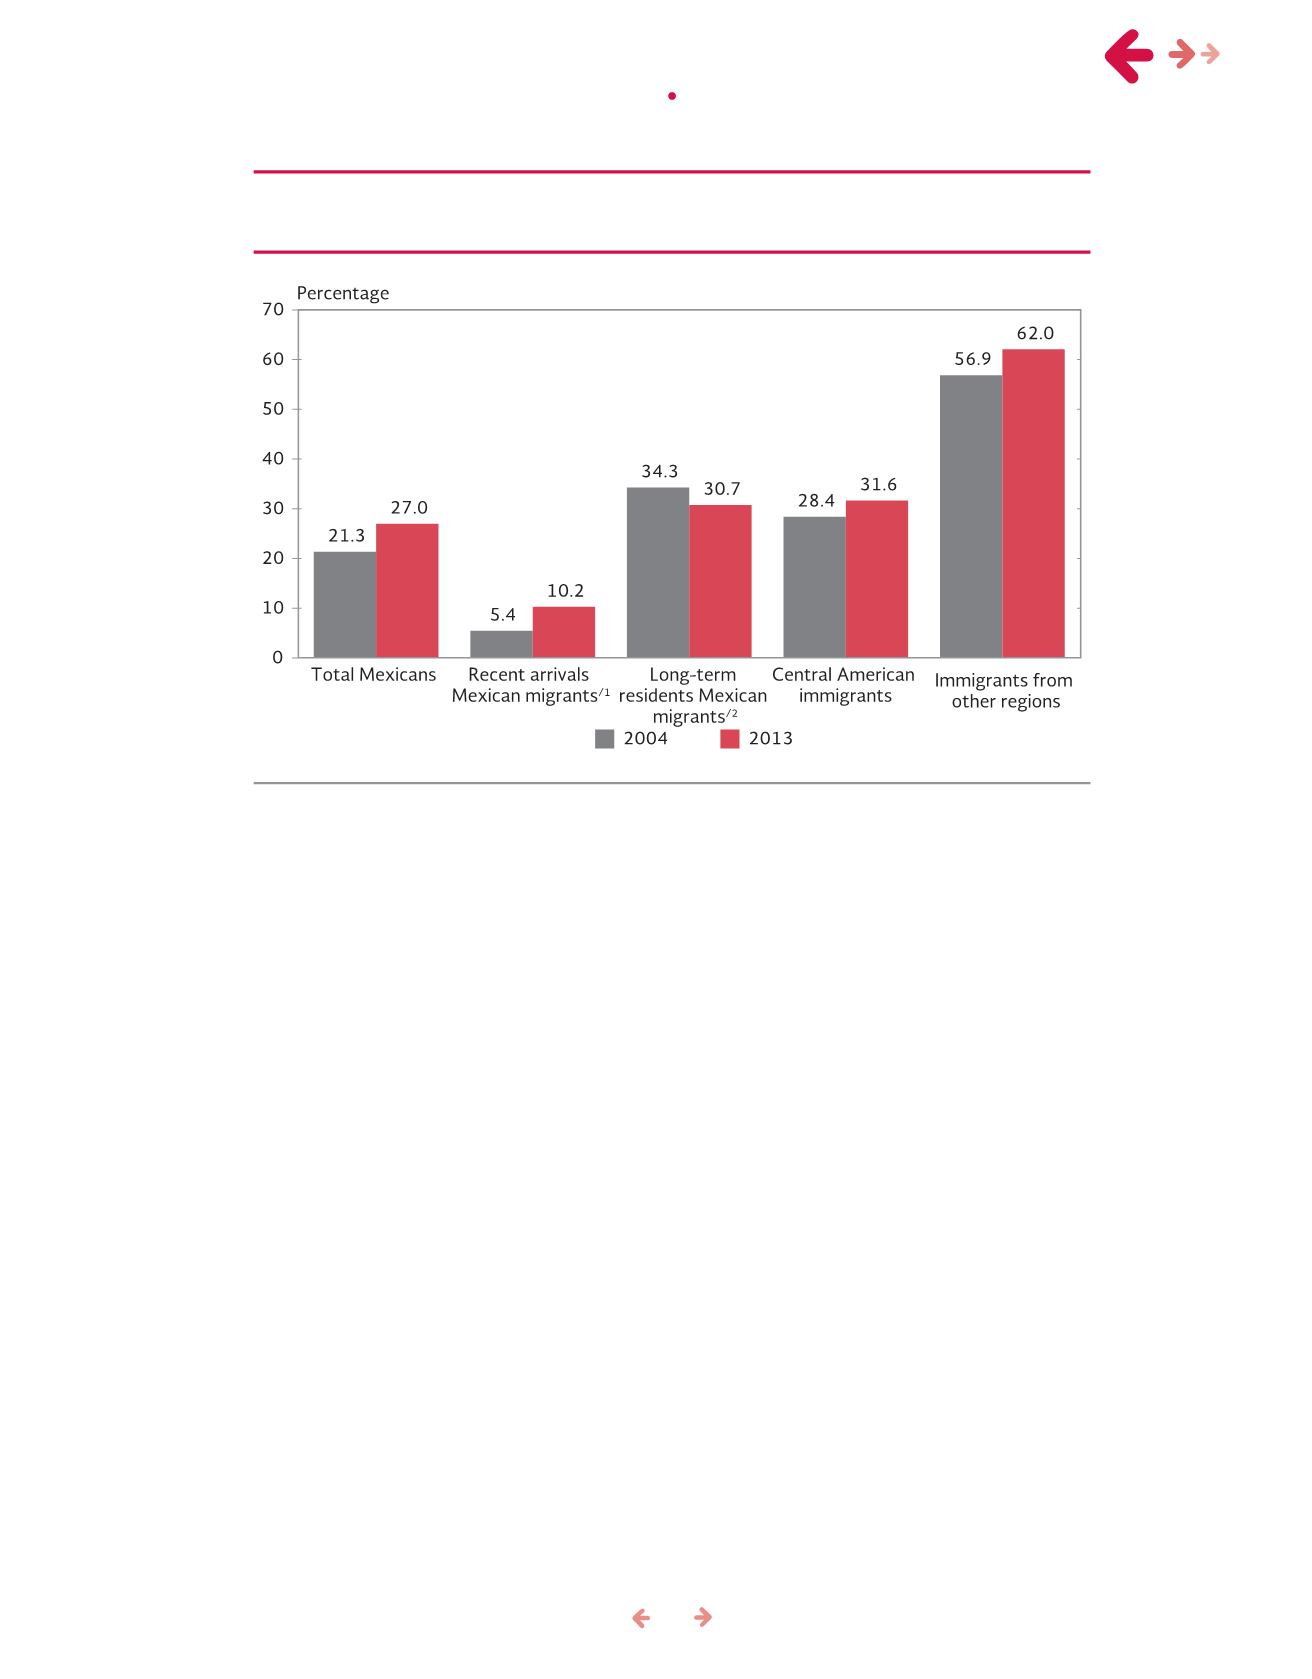
1/Recent arrivals: arrivedbetween1994and2004 for 2004; andbetween2004and2013 for 2013.
2/Long-term residents: arrivedbefore1994 for 2004; andbefore2004 for 2013.
Source: Migration Policy Bureau, SEGOB, based on U.S. Census Bureau,
Current Population Survey
(CPS), for March
2004andMarch2013. IntegratedPublicUseMicrodataSeries (IPUMS)USA,Minneapolis: UniversityofMinnesota.
Figure6. Immigrant population in theUnitedStateswithAmerican citizenship,
by regionof originand lengthof residenceofMexicans, 2004and2013
Households headedbyMexican
and citizenship
The proportion of households headed byMexican im-
migrants with American citizenship reflects the low
rate of naturalization among theMexican population.
Although between 2004 and 2013 the proportion of
Mexicanhouseholds inwhichallmembershaveAmeri-
cannationality roseslightly (bysixpercentagepoints),
nearly six out of ten households headed by aMexi-
can immigranthaveat leastonememberwithAmerican
citizenship and another without it, regardless of the
sizeof thehousehold (Figure7). Themajorityof these
mixed status households include the children of heads
of households who have acquired US nationality as a
result of havingbeingborn in the country.
Mexicansconstitutethe
largestgroupof immigrant
workers
Mexicanmigration to the United States is principally
for labor purposes and is largely determined by the
sharp contrasts in terms of employment and sala-
ries between the two countries. Mexican immigrants
contributed approximately 6.7million persons to the
economically active population (eap) in 2004, which
rose to 7.5million in 2013, making them the largest
groupof foreignworkers.
Like other population groups, Mexicans resi-
dent in the United States have a high rate of econo-
mic participation (65%), though lower than that of
immigrants from Central America (72%), all remai-
ning immigrants (67%) and US-born non-Hispanic
whites and only higher than that of African Ameri-
cans (55%) (Figure8).
chapter i •
characteristics of mexican immigrants in the united states


